Time-Based vs Price-Based Charts: Only One of Them Can Carry a Bot

Heads up: some links below are affiliate links. If you sign up through them we may earn a commission at no extra cost to you - it never changes what we recommend.
TradingView sorts chart types into two families: time-based charts draw a new element as time passes, and price-based charts draw one only when price moves a set amount. Price-based charts are calculated from lower timeframe bars, so anything that places an order belongs on a standard time-based chart.
The LPFT Copilot runs a rules-based system on your own Tradovate account and reports what the broker actually filled. Start a 7-day free trial.
Start your 7-day free trialThe time based vs price based charts split is TradingView's own, and it has two sides
This comparison usually gets written as a style question. Some traders like the clock, some like movement, pick whichever suits your personality. That framing is comfortable and it skips the one fact that decides which chart you can safely automate from.
Start with the classification, because TradingView publishes it and the wording is short. Time-based charts use time as the basis for drawing new chart elements, and time is displayed linearly along the horizontal axis. Price-based charts do not factor in time, and they draw chart elements only when a specified price change occurs.
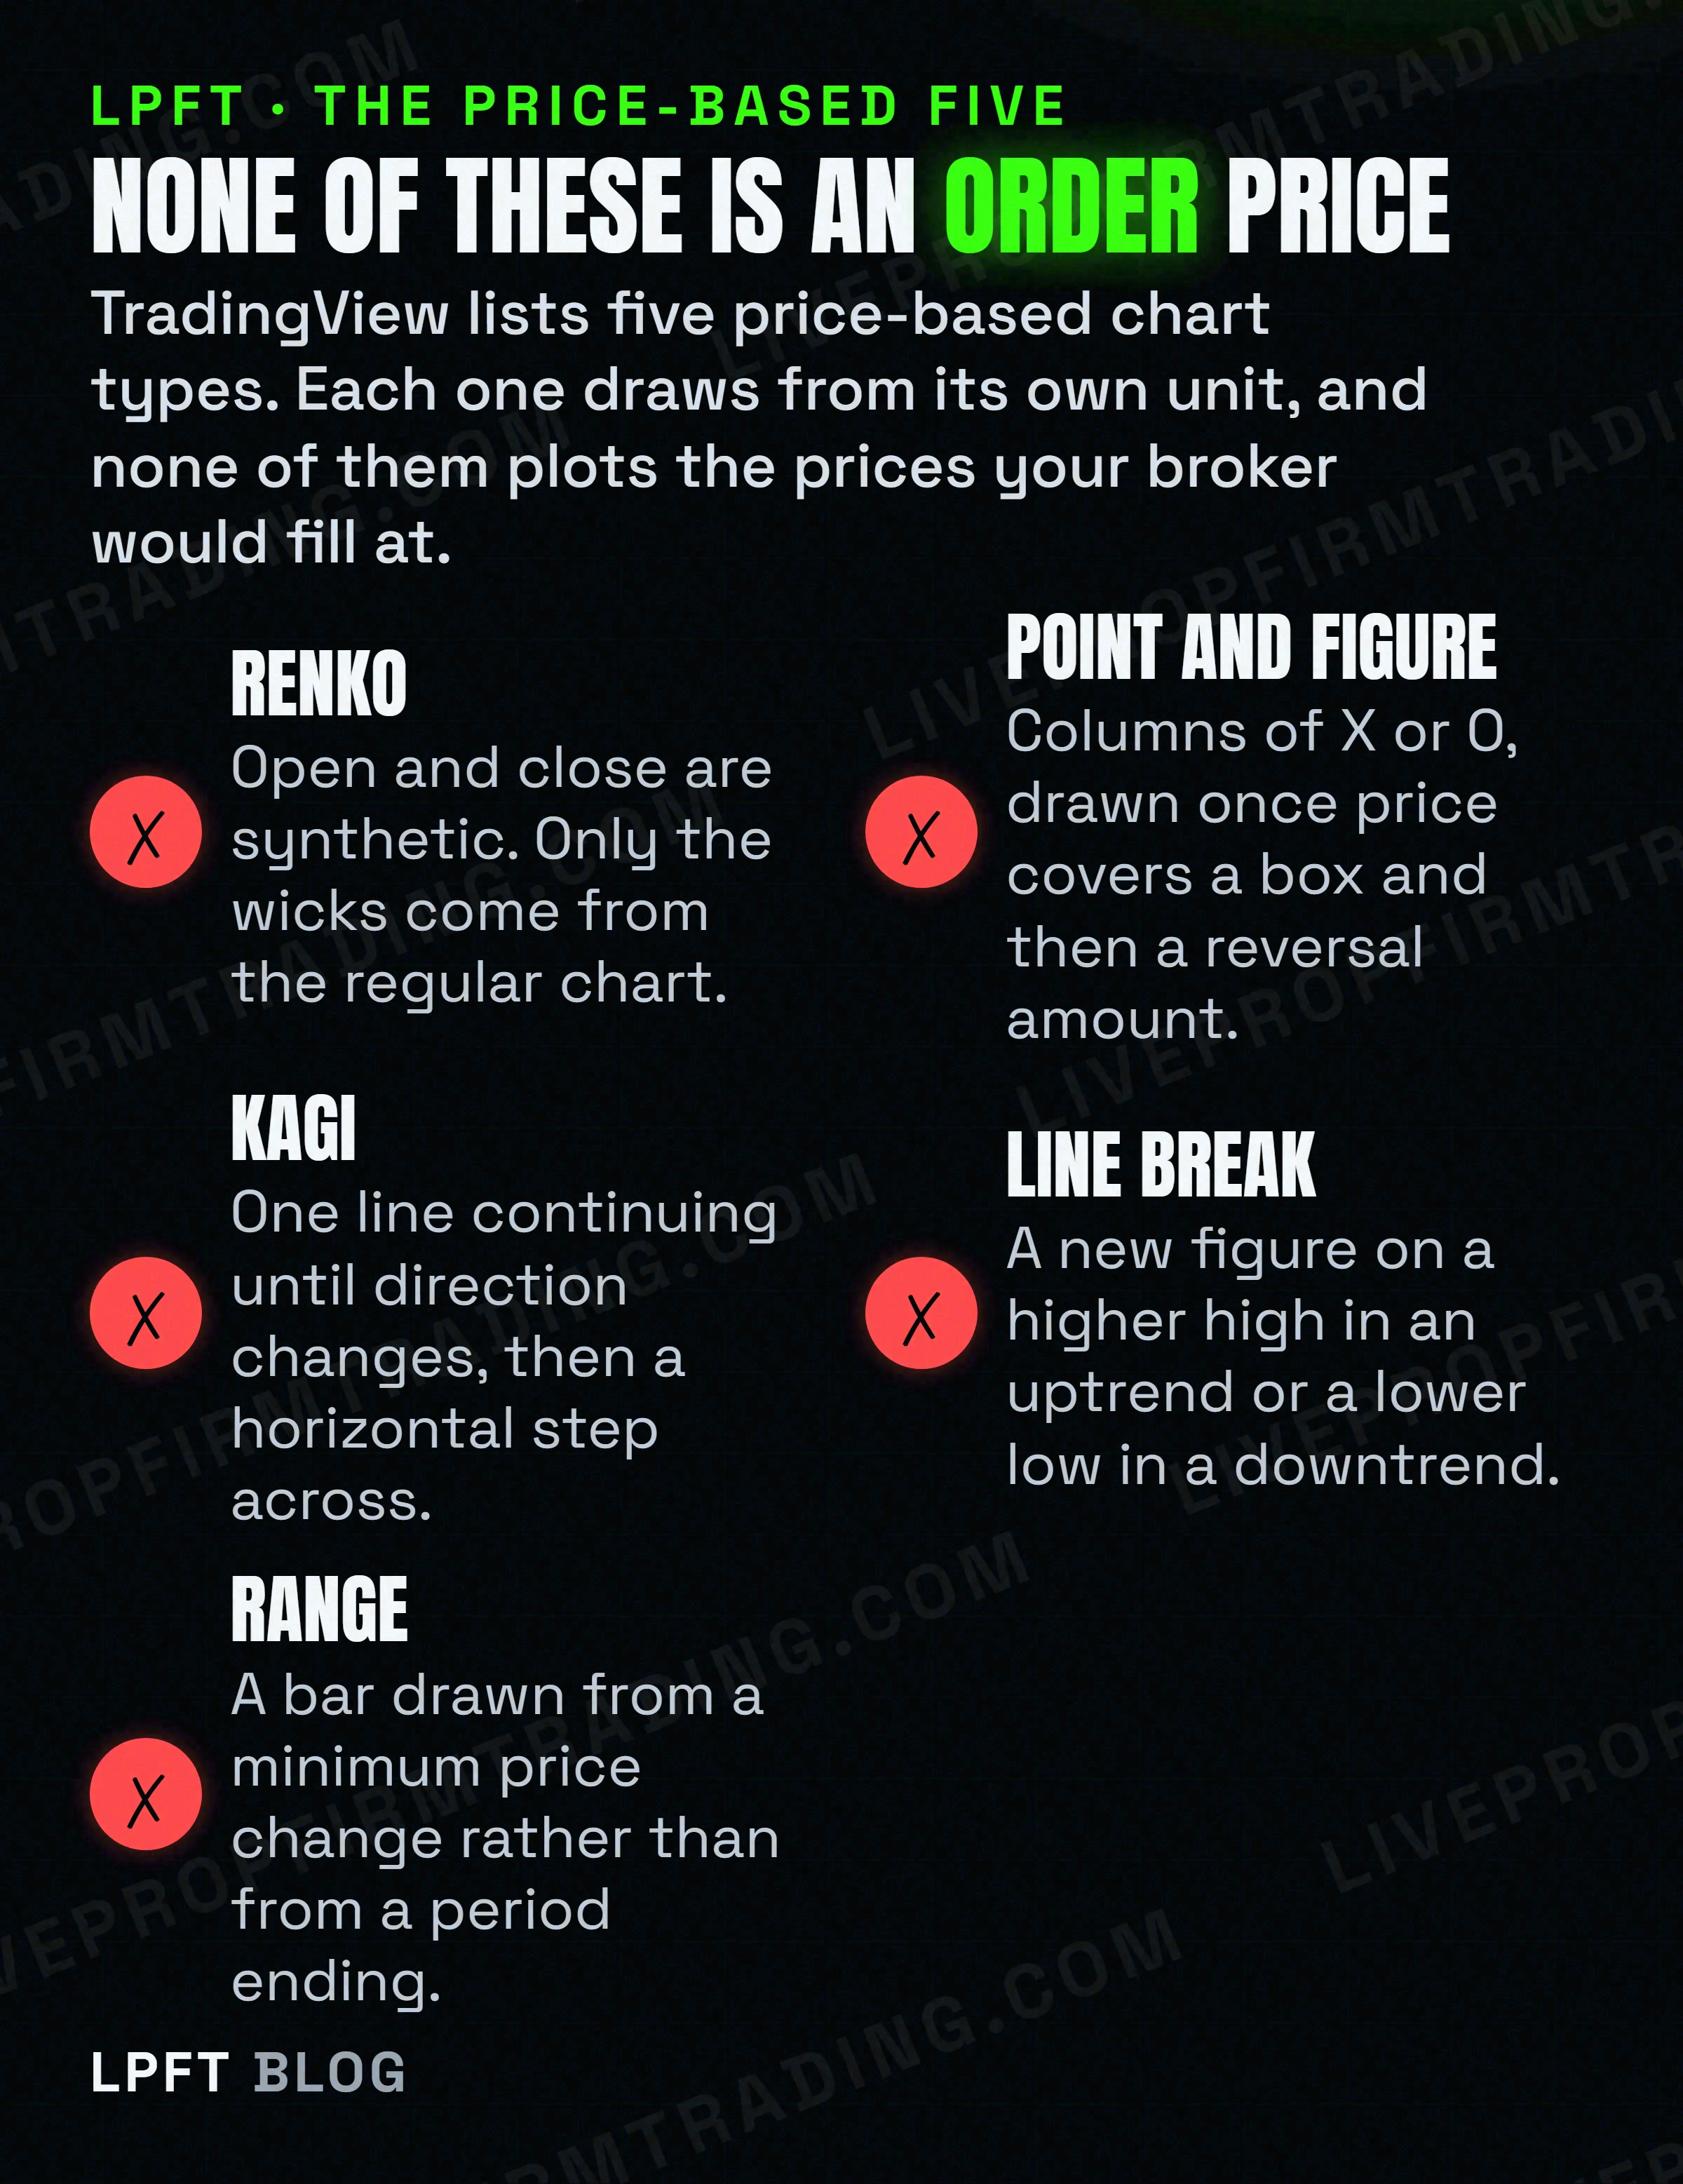
They also name the members. The price-based family is Renko charts, line break charts, Kagi charts, point and figure, and range charts. Everything else in the Supercharts list, which they put at more than twenty chart types, draws on the clock.
On a time-based chart, a quiet hour still produces bars. On a price-based chart, a quiet hour can produce nothing at all, and a violent ninety seconds can produce a dozen elements. Neither chart is lying. They are answering different questions, and only one of them has a horizontal axis you can reason about.
What actually draws the next element on each one
The five price-based types are usually lumped together as "non-standard" and left there. They are not interchangeable. Each one has its own trigger, and each trigger is a number you chose.
| Chart type | What draws a new element | What you are setting |
|---|---|---|
| Renko | Price moving more than the box size, above or below the most recent box. Corners always touch and there is never more than one box per column. | The unit of movement, by ATR, by a fixed absolute value, or by a percentage of the most recent close. |
| Point and figure | Columns of X for rising prices and O for falling. TradingView states the X and O marks occupy a space called the box size, a value you define. | Two numbers rather than one. The box, plus a reversal amount that specifies how many boxes price must move for a new letter or column to be created. |
| Kagi | Vertical and horizontal lines drawn as long as the downward or upward movement continues. A horizontal step marks a direction change. | How much of a move counts as a change of direction. |
| Line break | A new figure when price reaches higher highs in an uptrend or lower lows in a downtrend, using the previous lines to decide whether it rises or falls. | How many previous lines the comparison looks back across. |
| Range | A minimum price change, which is the whole rule. | The size of that minimum move. |
Notice what every row in the right-hand column has in common. On a time-based chart you pick an interval and the market fills it in. On a price-based chart you pick the unit of significance, which means you are partly drawing the chart yourself. Two traders looking at the same instrument on the same price-based type can be looking at genuinely different pictures, and neither screenshot shows which settings produced it.
The Renko version of that problem, which is the one most people meet first, is unpacked in how to read a Renko chart.
You did not remove time from the chart. You buried it.
Here is the part the style-preference framing hides, and it comes from TradingView's own Pine Script documentation rather than from an opinion.
Renko, line break, Kagi and point and figure charts construct bars using price data from lower timeframes. Not from the raw tape. From bars on a smaller time-based chart underneath. The same documentation adds that the bars on these chart types only approximate the values that correspond to calculations using tick data.
TradingView's Renko support page says the same thing from the other direction: accurate calculation requires tick data, they cannot supply complete historical tick data, and so the chart's timeframe determines the finest level of detail used to calculate the boxes.
A price-based chart is a layer computed on top of a time-based one. You removed time from the horizontal axis you look at, and you kept it in the calculation you cannot see. That is why the same chart can redraw itself when the calculation boundary moves, and it is why a price-based chart has a timeframe setting at all. If time were truly gone, there would be nothing to set.
None of that makes these charts bad. It makes them derived. A derived picture is fine to look at and a poor thing to measure against, which is exactly the distinction the next section turns into a decision.
Which family suits a bot, in one sentence of theirs
TradingView answers this while explaining Heikin-Ashi, and the clause generalises to every chart that invents its own prices. Those values are synthetic, they are not actual market prices, and the chart is unsuitable for automation because orders execute on market prices.
Read the last five words again, because they settle the whole question. An order fills at a market price. A price-based chart does not plot market prices. So a rule that produces an order has to be measured against the prices an order can actually get, which means a standard time-based chart.
They say it directly about testing too. The performance results from a strategy applied to non-standard charts, naming Heikin Ashi, Renko, line break, Kagi, point and figure and range, do not reflect actual market conditions by default. On Renko specifically: box levels, being disconnected from actual market prices at any given moment, will fill orders using their own prices and therefore will not produce reliable strategy results.
Their repainting documentation goes further and files a strategy executing on a non-standard chart under unacceptable, alongside scripts that leak future data into the past. The tiers behind that word are in TradingView backtest repainting, and the habits that keep a test honest are in how to backtest before you automate.
Deciding that a bot belongs on a standard chart does not get the order to your broker. That is a separate piece of plumbing, and a bridge service like TradersPost is the usual way people solve it without writing one. Worth knowing what it does before you build anything.
See how TradersPost handles it →And none of this stops you watching a Kagi or a Renko chart while a system runs on candles. Looking and measuring are different jobs. Confusing them is how a beautiful backtest turns into an account that behaves nothing like it.
Where a price-based chart genuinely wins
A fair comparison has to include what these charts are actually good at, because it is real and it is the reason they have lasted.
| Time-based | Price-based | |
|---|---|---|
| What creates a new element | An interval ending | Price moving by the amount you set |
| Are the plotted prices real | Yes, on a standard chart. Open, high, low and close all traded. | No. They are calculated from lower timeframe bars and only approximate tick data. |
| Can you see a quiet period | Yes, as bars that barely move. Information you may want. | No. A quiet period simply does not draw, which is the appeal. |
| Reading trend direction | Workable, with more visual noise | Genuinely easier. This is what the family is for. |
| Duration of one element | Known and fixed | Unknown. Could be seconds, could be days. |
| Suitable for a strategy or a bot | Yes, on a standard chart | No. TradingView states these do not reflect actual market conditions by default. |
The duration row is where a price-based chart quietly misleads a careful reader. Two neighbouring elements look equally significant and may represent wildly different amounts of time. A trader judging momentum from that is reading a picture with the clock taken out, which is precisely what they asked for and rarely what they meant.
So the honest split is not time versus price. It is looking versus measuring. Price-based charts are a good viewing layer. Time-based charts are the measuring surface, and they are the only ones whose prices your broker recognises.
How to run both without letting the chart decide for you
- Pick the family by the job. If you are deciding what you think, use whichever chart makes it clearest. If you are deciding what an order does, use a standard chart.
- Never backtest on a price-based chart. TradingView states the results do not reflect actual market conditions by default, and on Renko that orders fill at the chart's own prices.
- Write down the unit, not just the chart type. "Renko" is not a setting. The box method and value, or the reversal amount, is the setting.
- Check the timeframe on a price-based chart. It is not decoration. It decides how finely every element on screen was calculated.
- Treat the newest element as provisional. On these charts the right edge can recalculate until the underlying bar closes.
- Distrust any price-based screenshot used as proof, because the settings that produced it are not visible in the picture.
Keep the plain reality alongside all of it. Trading futures involves substantial risk of loss, and switching chart families changes what you can see rather than what the market will do. A chart that made a trend look obvious in hindsight did not make it easier to trade at the time.
If the next question is whether the chart can act on what it shows, that has a precise answer in can TradingView place trades itself. And when a chart is driving alerts that are supposed to fire, the mechanical reasons they stop are in TradingView alerts not firing.
Frequently asked questions
TradingView states that time-based charts use time as the basis for drawing new chart elements, with time displayed linearly along the horizontal axis, while price-based charts do not factor in time and draw chart elements only when a specified price change occurs. A time-based chart prints through a quiet hour. A price-based chart may print nothing at all in it.
TradingView names five: Renko charts, line break charts, Kagi charts, point and figure, and range charts. Everything else in their chart list, which they describe as more than twenty chart types, draws new elements on the clock.
Only on the axis you look at. TradingView's Pine Script documentation states that Renko, line break, Kagi and point and figure charts construct bars using price data from lower timeframes, and that the bars only approximate the values that correspond to calculations using tick data. Time is still in the calculation, which is why these charts have a timeframe setting at all.
You can run one, and TradingView says the numbers will not mean what you think. Their documentation states that performance results from a strategy applied to non-standard charts, including Renko, line break, Kagi, point and figure and range, do not reflect actual market conditions by default, and explains elsewhere that orders execute on market prices rather than on a synthetic chart's prices.
It is genuinely better at making direction easy to see, because it only draws when price covers your chosen amount. What it removes along with the noise is duration, so two neighbouring elements can represent seconds and hours and look identical. Use it to see, and keep measuring on a standard chart.
A standard time-based chart. The deciding sentence is TradingView's own, written about Heikin-Ashi and true of every chart that generates its own values: those prices are synthetic rather than actual market prices, and automation is unsuitable because orders execute on market prices. A rule that produces an order has to be measured against prices an order can get.
Eli Y.
Eli builds and runs rules-based automated futures systems on TradingView and Tradovate, and helps traders take emotion out of the screen. He writes about futures automation, prop-firm evaluations, and the tools that connect them - plainly, and without hype.
Risk disclosure: Trading futures involves substantial risk of loss and is not suitable for everyone. This article is educational content only and is not financial advice or a recommendation to trade. Past performance is not indicative of future results. Some links are affiliate links.