TradingView Backtest Repainting: Four Kinds, and Only One Is Fatal

Heads up: some links below are affiliate links. If you sign up through them we may earn a commission at no extra cost to you - it never changes what we recommend.
Repainting breaks a backtest when the script calculates differently on realtime bars than on historical ones. TradingView states it outright: when a strategy repaints this way, it also invalidates backtesting results. Their docs sort repainting into four tiers, and only one is called unacceptable.
The LPFT Copilot runs a tested, rules-based method on your own Tradovate account, so there is no script of yours to interrogate and no report to second-guess. 7-day free trial.
Start your 7-day free trialWhat repainting actually does to a backtest
Almost everything written about repainting treats it as a single yes-or-no defect. TradingView does not, and since it is their emulator producing the report, their wording is the one that matters.
Their definition is narrow and mechanical: script behaviour causing historical versus realtime calculations or plots to behave differently. Not dishonest. Not broken. Different, depending on whether the bar has finished.
The reason sits one level below that, and they state it plainly. Historical data does not include records of intra-bar movements of price, only open, high, low and close. A finished bar hands your script four numbers. A live bar hands it a price that keeps moving until the close. Any script whose answer depends on the difference will genuinely behave in two ways, and neither of them is a bug.
On strategies that calculate on every tick rather than on historical closes, TradingView writes that the two will most probably not generate the same order executions, and so repaint, and that when this happens it also invalidates backtesting results. That is their verdict on their own tool, not ours. A repainting strategy does not produce a slightly optimistic report. It produces a report about a sequence of fills that was never available.
So the useful question is never "does it repaint". Their own docs put the share of indicators that repaint in some form at more than 95 percent. The useful question is which kind, and that has a published answer.
The four tiers, and the only one you have to act on
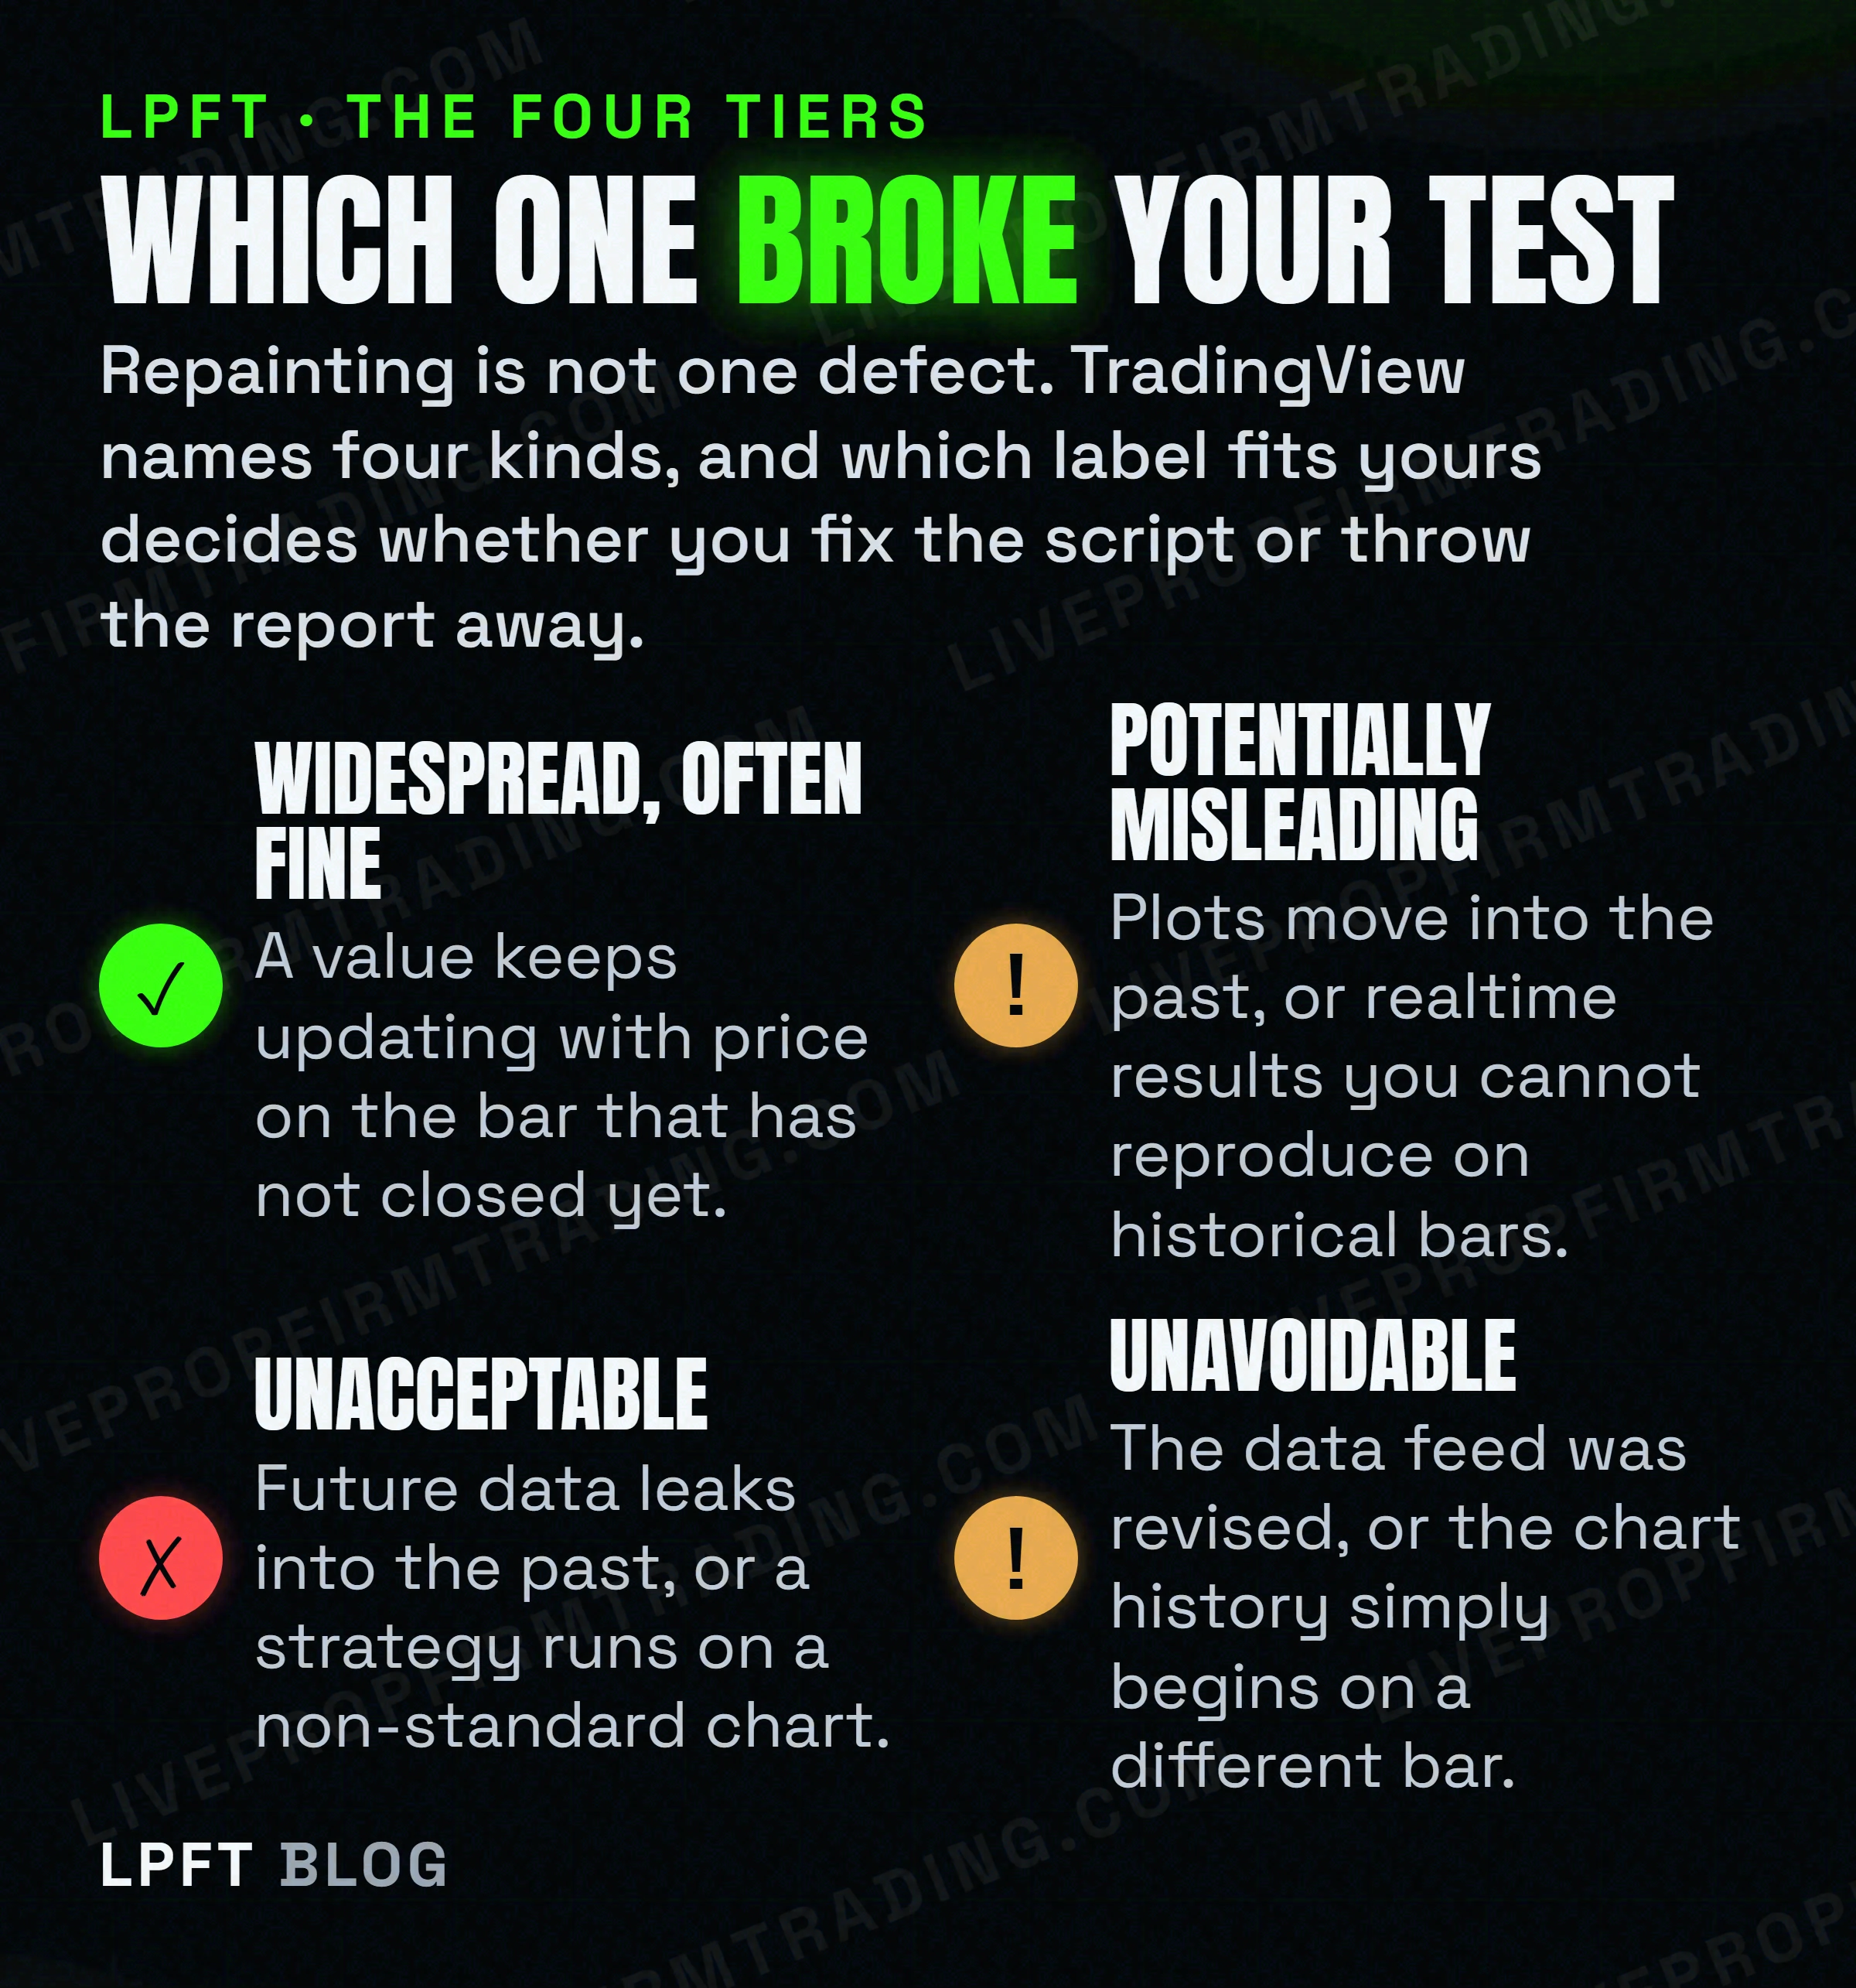
These are their headings, in their order, with what each one covers.
| Tier | What falls under it | What to do |
|---|---|---|
| Widespread but often acceptable | A script using values that update with realtime price changes on the unconfirmed bar. The current close on an open bar. Higher-timeframe data on a live bar. | Nothing. This is most indicators most of the time. |
| Potentially misleading | Scripts that plot values into the past, calculate results on realtime bars you cannot replicate on historical bars, or relocate past events. They name Ichimoku, pivot-based scripts, strategies calculating on every tick, some higher-timeframe requests, and scripts using varip or timenow. | Usable if you understand it. Not usable as evidence. |
| Unacceptable | Scripts that leak future information into the past, strategies that execute on non-standard charts, and scripts using realtime intrabars to generate alerts or orders. | The report is void. Fix the script or discard the numbers. |
| Unavoidable | Revisions of the data feed from a provider, and variations in the starting bar of the chart history. | Nothing you can code around. Know it moves your numbers. |
Notice what tier three includes. A strategy that executes on a non-standard chart is listed under unacceptable, not under a caveat. That covers Renko, Heikin Ashi, Kagi, point and figure, line break and range charts, which is exactly the set futures traders reach for. The prices those charts hand the emulator are not market prices, which is a separate subject covered in Renko versus candlestick charts.
And notice the balance TradingView keeps, which the "non-repainting indicator" marketing drops entirely. Their docs argue that not all repainting behaviour is inherently useless or misleading, and ask who would think of discrediting a volume profile indicator solely because it updates its values on realtime bars. An honest answer to "does this repaint" is usually yes, and usually fine.
The cause nobody writes about: where your chart history begins
This is the part worth the read, because it explains the most common version of the complaint and it is not repainting in the sense anyone means.
You run a backtest. You come back tomorrow, or open the same script on a second chart, and the numbers are different. Nothing in the code changed. The usual conclusion is that the script repaints. Often it does not.
TradingView states that all script calculations depend on their starting point, and that this affects the functions that carry state from bar to bar, naming valuewhen, barssince and ema, plus any backtesting strategy. Then they publish the alignment rules that decide where the history starts, and the rules are tied to the chart resolution.
- Resolutions of 1 to 14 minutes align to the start of the week.
- Resolutions of 15 to 29 minutes align to the start of the month.
- Resolutions of 30 minutes and above align to the start of the year.
Read that together with how a strategy accumulates. Every trade in the report depends on the state the script was in when it reached that bar, and that state was built from the first bar onward. Move the first bar and you have run a different test. A five minute strategy tested on a Tuesday and again on the following Monday is not being tested on the same sample.
If your numbers move because the sample moved, no amount of fixing the script will stabilise them. The fix is to record which range you tested, and to compare like with like. It is also the strongest practical argument for using a fixed date range rather than whatever the chart happens to hold, which is what Deep Backtesting gives you. The mechanics of that are in how to backtest a Pine Script strategy.
TradingView also lists changes in historical data, giving a split as the example. Same effect, different trigger. Your report is a statement about a dataset, and the dataset is not a constant.
The six causes, in the order TradingView lists them
Their support page enumerates what actually produces different results after a reload. It is worth reading as a checklist, because four of the six are decisions you made and two of them are not.
- A strategy calculating on every tick. They add the part people miss: a strategy with that parameter set to false may also be prone to repainting, but to a lesser degree. Turning it off reduces the problem rather than removing it.
- Requesting a higher timeframe. Asking for data from a resolution above the chart produces different calculations regardless of how the lookahead setting is configured.
- Requesting a lower timeframe. The same call pointed downward repaints when lookahead is off.
- The starting point. The alignment rules above, plus any function that carries state forward.
- Changes in historical data. Their example is a split.
- Certain variables being present at all. They name the barstate family, timenow and bar_index.
The dangerous one is not on that list, because it lives in the language docs instead. A higher-timeframe request made with lookahead switched on and no offset by one bar will return data from the future on historical bars. TradingView describes that as dangerously misleading, and it is the mechanism behind every screenshot of a strategy that catches the exact top of every move. The report is not optimistic. It knew.
If the difference between an indicator and a strategy is still fuzzy, that boundary is covered in indicator versus strategy in Pine Script, and which indicators can be measured at all is in the best TradingView indicators for futures.
How to diagnose it, using what TradingView publishes
Most guides tell you to screenshot a chart, wait, and compare. That works and it is slow. There are two faster methods and both come from TradingView.
Tint the realtime bars and watch the seam
Their repainting documentation publishes a one-line diagnostic: colour the background whenever the bar is realtime rather than historical. Every repainting script shows its character at that seam, because the seam is precisely where the two calculation modes meet. You do not have to wait a day to see it. You have to look at the boundary that is already on your screen.
Require the bar to be finished, then compare
TradingView states that using the confirmed-bar condition is actually one way to avoid repainting, and shows it as an added condition on a cross detection so the script only counts the bar's last iteration, when it closes. Run the strategy with that condition and without it. If the two reports differ, the gap between them is the size of the illusion you were reading. If they match, the repainting you have is in tier one and you can stop worrying.
Bar Replay is the third option and is on every plan, which makes it the cheapest sanity check available. Note what it does and does not prove. It replays the recorded bars, so it shows you how the script behaves as bars arrive. It does not recreate the ticks inside those bars, which is the thing the emulator was guessing about in the first place.
The bar-by-bar replay, the alert log and the Strategy Tester are all TradingView features, and the plan tier decides which of them you get. If you are going to audit a script properly, it is worth knowing which tier you are on before you conclude the script is at fault.
Look at TradingView plans →One caution on all three methods. They tell you whether the script is consistent. They do not tell you whether the fills were realistic, because that depends on assumptions the emulator makes about price inside a bar, which is a different failure with a different fix. Both are covered from the habits side in how to backtest before you automate.
What to do once you know which kind you have
- Name the tier before you name the fix. Widespread, potentially misleading, unacceptable or unavoidable. Three of the four do not call for a code change.
- Check the chart type first. A strategy on a non-standard chart is in the unacceptable tier by TradingView's own classification. Move to a standard chart and rerun before you debug anything else.
- Search your own code for a lookahead. A higher-timeframe request with lookahead on and no offset by one bar is the single worst case and the easiest to find.
- Write down the date range you tested. Not the timeframe. The range. Otherwise the starting-point rules will move your numbers and you will blame the script.
- Run it with the confirmed-bar condition and compare. The difference between the two reports is the measurement you actually wanted.
- Then stop trusting the report anyway. A clean, non-repainting backtest is a hypothesis about the past. It is not evidence about your fills.
That last point is the one that costs money. A report can be internally consistent, free of lookahead, on a standard chart, over a fixed range, and still be nothing like what your account does, because a backtest does not queue for liquidity and does not pay your commissions unless you told it to. Trading futures involves substantial risk of loss, and a repainting audit removes one specific illusion rather than all of them.
The honest next step after a clean report is forward testing the same rules on live data and comparing, which is the subject of paper trading versus live bot testing. And if you are wondering whether TradingView can simply run the thing for you once it checks out, the answer is more specific than most pages admit and it is in can TradingView place trades itself.
Frequently asked questions
TradingView defines it as script behaviour causing historical versus realtime calculations or plots to behave differently. The root cause is that historical data does not include records of intra-bar price movement, only open, high, low and close, so a script that depends on how price moved inside a bar has to behave one way on history and another way live.
It can, and TradingView says so directly. On strategies calculating on every tick rather than on historical closes, their docs state the two will most probably not generate the same order executions, and so repaint, and that when this happens it also invalidates backtesting results. Repainting in their milder tiers does not have that effect.
Colour the chart background whenever the bar is realtime rather than historical and look at the seam between the two, which is the diagnostic TradingView publishes in its own repainting documentation. Then rerun the strategy with a condition requiring the bar to be confirmed and compare the two reports. The difference is the size of the effect.
Often it is not the script. TradingView states that all script calculations depend on their starting point and publishes the alignment rules that decide it: resolutions of 1 to 14 minutes align to the start of the week, 15 to 29 minutes to the start of the month, and 30 minutes and above to the start of the year. A different starting bar is a different sample.
Not automatically, and TradingView pushes back on the idea. Their docs put the share of indicators that repaint in some form at more than 95 percent, and argue that not all repainting behaviour is inherently useless or misleading, asking who would discredit a volume profile indicator solely because it updates its values on realtime bars.
TradingView reserves that word for three cases: scripts that leak future information into the past, strategies that execute on non-standard charts, and scripts that use realtime intrabars to generate alerts or orders. The clearest example of the first is a higher-timeframe request with lookahead enabled and no offset by one bar, which they describe as dangerously misleading.
Eli Y.
Eli builds and runs rules-based automated futures systems on TradingView and Tradovate, and helps traders take emotion out of the screen. He writes about futures automation, prop-firm evaluations, and the tools that connect them - plainly, and without hype.
Risk disclosure: Trading futures involves substantial risk of loss and is not suitable for everyone. This article is educational content only and is not financial advice or a recommendation to trade. Past performance is not indicative of future results. Some links are affiliate links.