The Best TradingView Indicators for Futures: An Honest List

Heads up: some links below are affiliate links. If you sign up through them we may earn a commission at no extra cost to you - it never changes what we recommend.
There is no single best indicator for futures. The useful ones each do one job: trend, volatility, momentum or location. What matters more than the choice is whether you can read the source code and whether the value still stands once the bar has closed.
The LPFT Copilot runs a tested, rules-based method on your own Tradovate account, so there is no indicator to pick and no settings to second-guess. 7-day free trial.
Start your 7-day free trialWhat actually changes when the instrument is futures
Nearly every list of the best TradingView indicators for futures is the same list you would get for crypto or stocks, with the word futures pasted on top. The indicators are not wrong. The problem is that three things about futures change how you should read any of them, and the generic lists mention none of the three.
- The symbol you chart may not be the symbol you trade. TradingView states that you can trade 1! continuous contracts for CME and EUREX futures, and that the order will be set for the front contract, meaning the nearest expiration month currently included in the 1! contract. So an indicator on MES1! reads a stitched history while the order lands on one specific contract.
- The chart type can invalidate the test. TradingView states that performance results from a strategy applied to non-standard charts, which includes Renko, Heikin Ashi, Kagi, point and figure, line break and range, do not reflect actual market conditions by default.
- Most indicators change their mind. More on that below, with TradingView's own number attached.
Get those three straight and the actual choice of indicator becomes a much smaller decision than the internet suggests.
The best TradingView indicators for futures, grouped by the job they do
A useful setup is not five indicators that all say the same thing. It is one tool per question, where each question is something you cannot answer from price alone. These are all built into TradingView, which means the calculation is documented and the same for everyone who loads it. That is the single most underrated quality in an indicator.
| The question | The tool | Why it suits futures |
|---|---|---|
| Which way is this trending? | Moving averages, simple or exponential | Deterministic and cheap to run. A stack of two or three gives you direction without a new opinion on every tick. |
| How much is it moving right now? | Average True Range | Converts a stop distance into a number that adapts. On a contract where one tick has a fixed dollar value, this is how a stop stays the same size in money across a quiet and a busy session. |
| Where has the volume actually traded? | Volume Profile | TradingView describes it as an advanced charting indicator that displays trading activity over a specified time period at specified price levels, and offers six variants including session, visible range and fixed range. |
| What is the fair price for this session? | VWAP, and anchored VWAP | A single reference line both sides of the market can see. Anchoring it deliberately matters more on a contract that trades nearly round the clock. |
| Is the move stretched? | RSI or MACD, pick one | Both are standard and well understood. Both also keep moving until the bar closes, which is the caveat in the next section. |
That is four or five plots, not fifteen. If you want the reasoning behind keeping the count low rather than the list itself, the myths about automated trading covers why more inputs usually means a more fragile system rather than a better one.
TradingView says more than 95% of indicators repaint
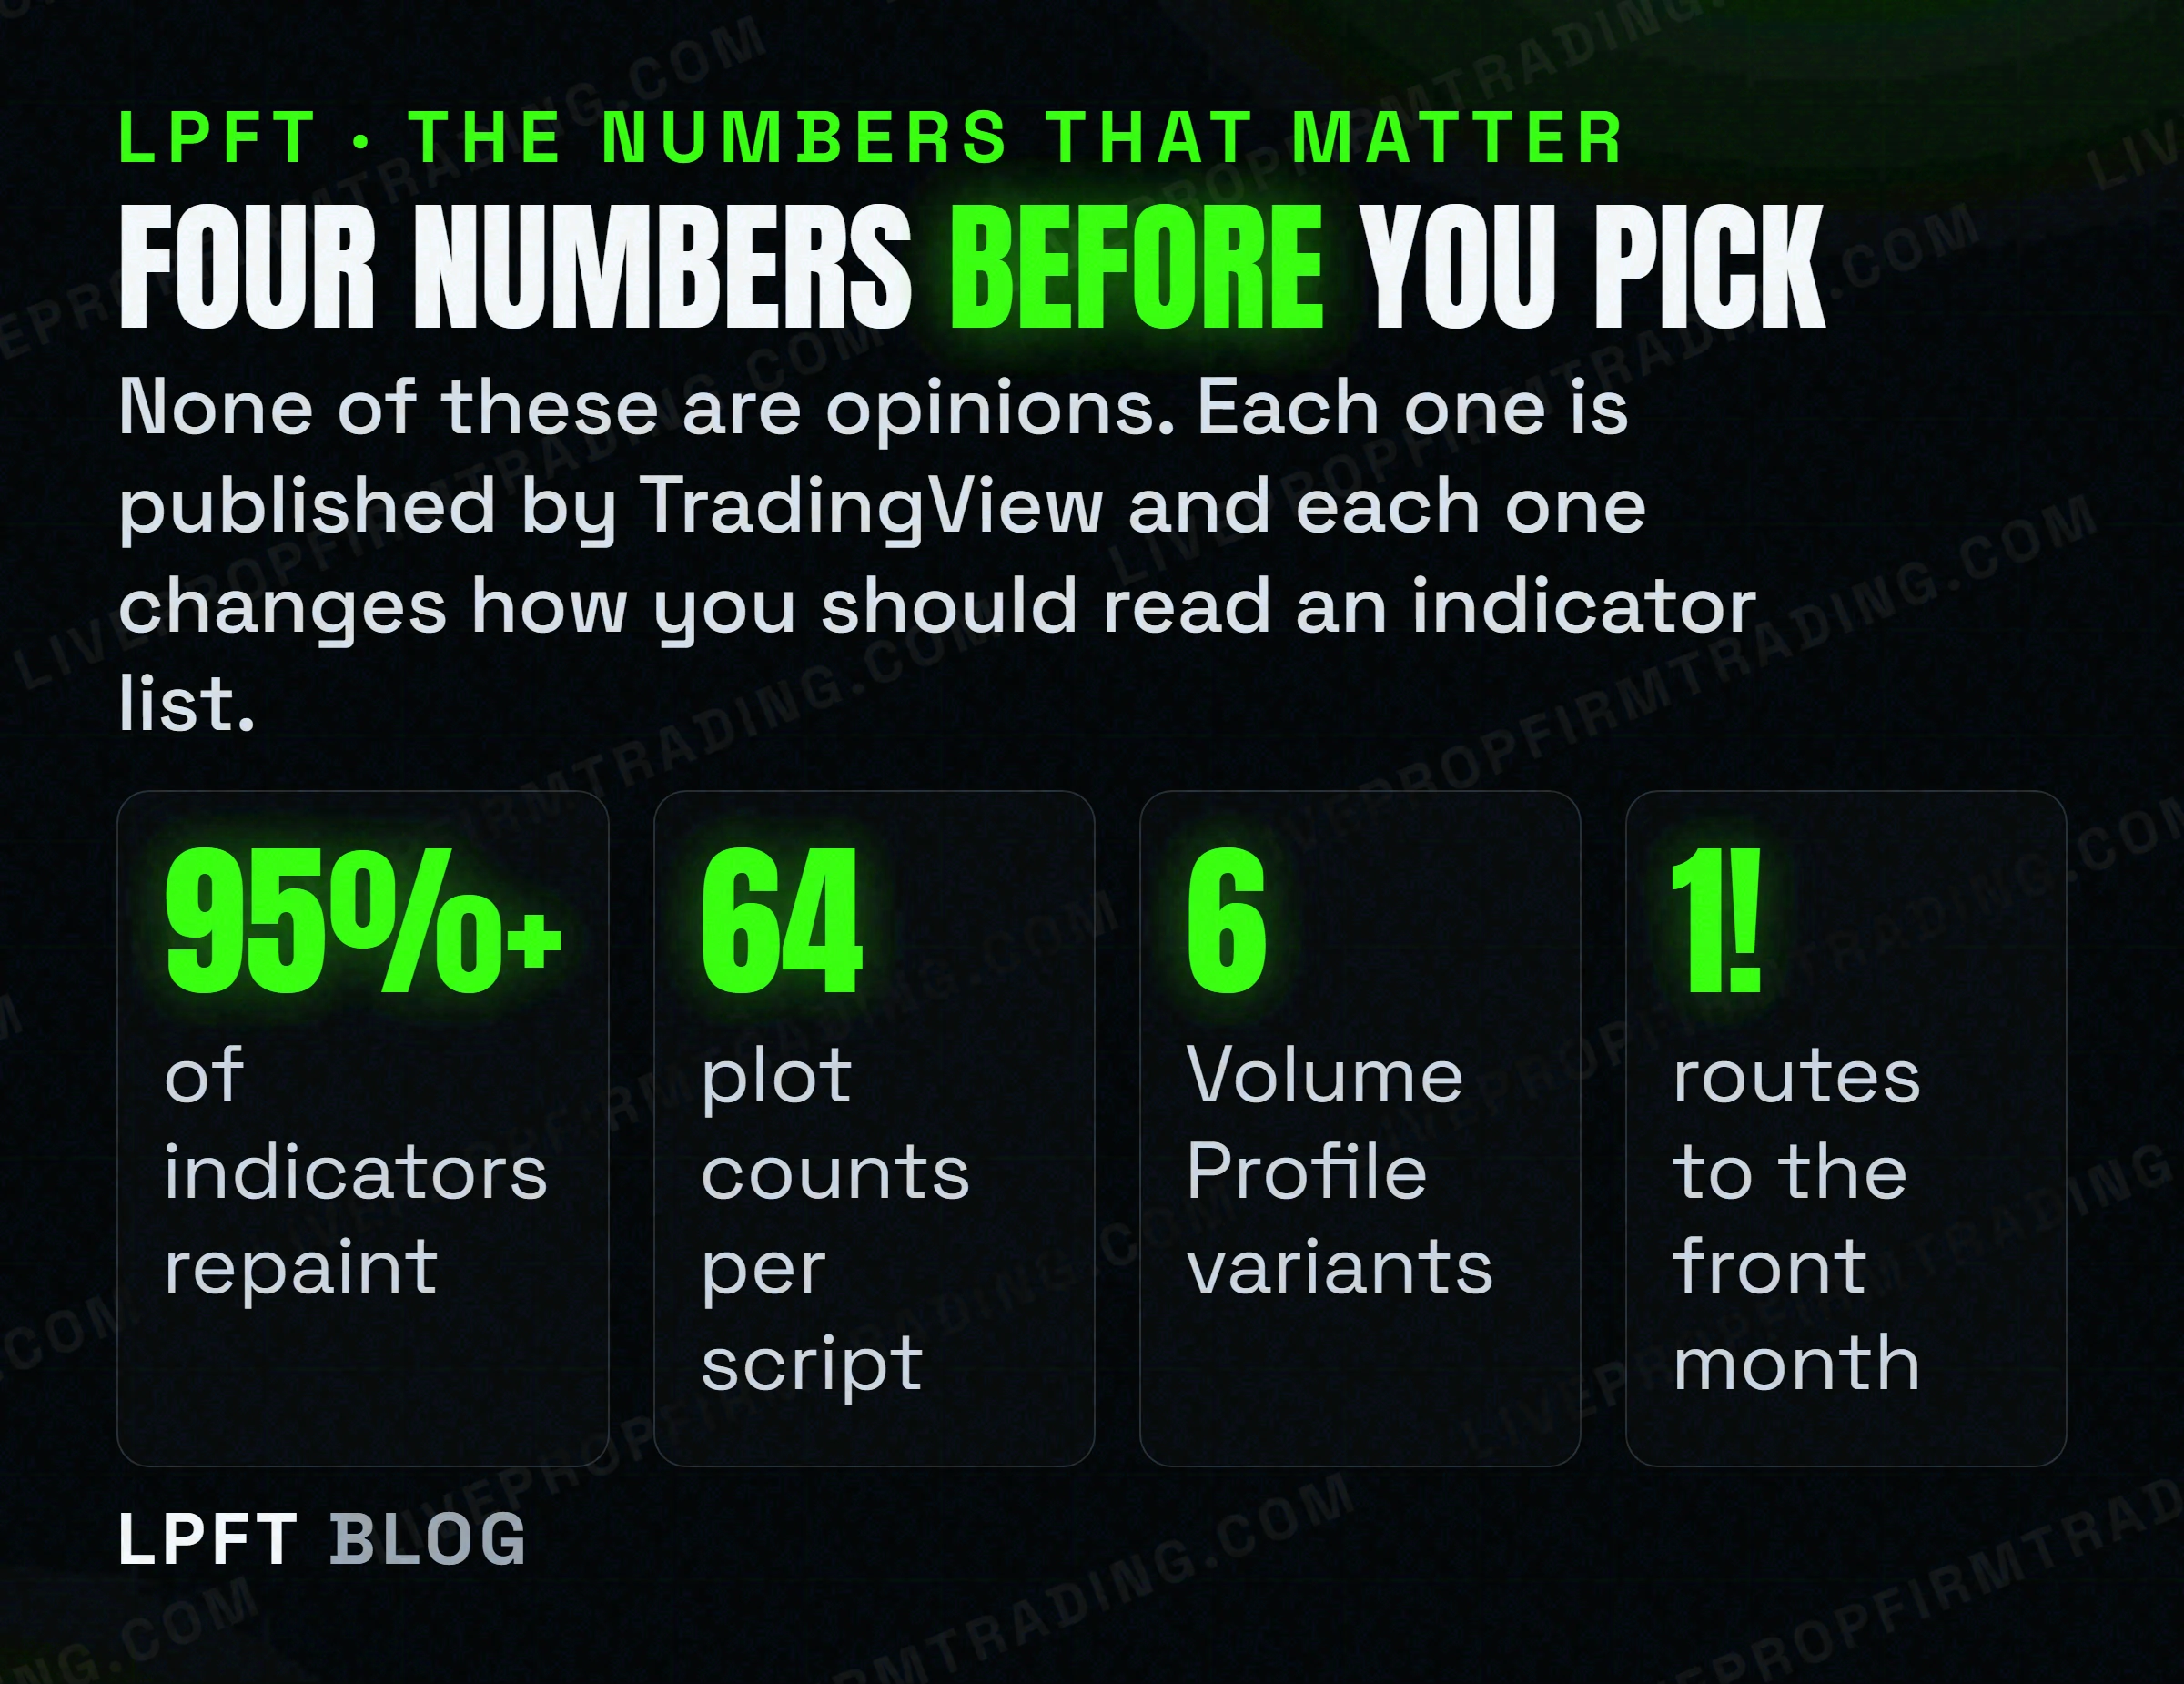
This is the fact that should reorganise any indicator list, and it comes from TradingView's own documentation rather than from a forum. They define repainting as script behaviour causing historical and realtime calculations or plots to behave differently, and they state that more than 95% of indicators in existence exhibit some form of repainting behaviour.
They are equally clear about what that does and does not mean. Commonly used indicators such as MACD and RSI, in their words, show confirmed values on historical bars but will fluctuate on a realtime, unconfirmed chart bar until it closes.
TradingView also writes that not all repainting behaviour is inherently useless or misleading, nor does such behaviour prevent knowledgeable traders from using indicators with such behaviour, and asks who would think of discrediting a volume profile indicator solely because it updates its values on realtime bars. Anyone selling you a non-repainting indicator as the whole solution is selling a label, not a property.
The practical consequence is narrow and important. Decide which value of the indicator your rule refers to, the live one or the closed one, and then make the alert agree with that decision. That is exactly the setting covered in the alert settings that decide whether a trade fires, and getting it wrong is the most common reason a live system and its report disagree.
The ones you cannot check at all
A large share of the indicators pushed as the best for futures are paid scripts you cannot read. TradingView publishes exactly what each visibility setting means, and the wording decides whether an honest review is even possible.
| Visibility | What TradingView says | Can you audit it? |
|---|---|---|
| Open | Every user is able to see a source code of your script, apply it to the chart and add it to favorites. | Yes, fully |
| Protected | Every user can add this script to the chart or favorites, but only the author can see the source code. | No, behaviour only |
| Invite-only | Nobody can add it to a chart without explicit permission from the author and only the author can see the source code. | No, and not without access |
This is not an accusation. Plenty of protected scripts are good, and an author has every right to protect work. It is a statement about what you can know. With a protected or invite-only script you cannot check whether it references future data, you cannot see whether it repaints, and you cannot convert it into a strategy, because there is no source to convert. If your plan is to automate the thing, that last point ends the conversation. Turning an indicator into a strategy explains why.
An indicator draws. It does not trade. Once you have a rule you trust, something has to carry the signal from TradingView to a broker. TradersPost is a cloud service that receives TradingView webhooks and routes them to a broker, with Tradovate explicitly supported, and it has a free 7-day trial.
Look at TradersPost →Two ceilings that decide how many you can stack
There is a hard limit to indicator collecting, and it is published. TradingView allows a maximum of 64 plot counts per script, and each alertcondition() call consumes one of them. Script execution across a dataset is limited to 20 seconds for basic accounts and 40 for others, with a two-minute ceiling on compilation.
In practice you will feel the second limit before the first. A chart carrying a dozen heavy scripts gets slow, and a slow chart is a chart you stop trusting mid-session. These were TradingView's published ceilings when we checked them, and numbers like these do move, so read them as the current shape of the constraint rather than permanent figures.
The other ceiling is the chart type, and it is the one futures traders hit most. Renko in particular is popular on futures and is explicitly named by TradingView among the non-standard charts whose strategy results do not reflect actual market conditions by default. You can look at whatever chart helps you think. Just do not measure a system on one. The honest version of that process is in how to backtest before you automate.
How to choose, in four questions
- What question does this answer that price alone does not? If you cannot say it in one sentence, you are adding a plot, not information.
- Can I read the source? Open means yes. Protected and invite-only mean you are trusting behaviour you cannot inspect, and cannot automate from.
- Does its value change after the bar closes? Assume yes, because TradingView says more than 95% show some form of repainting. Then decide which value your rule refers to.
- Does it survive contact with an order? An indicator that looks perfect on a Renko chart is not measurable, and one whose signal only exists mid-bar needs an alert configured to match.
Trading futures carries a substantial risk of loss, and no indicator changes that. An indicator is a measurement, not a decision, and a measurement with no rules around it is just a nicer looking chart. What turns one into a system is entry and exit rules, a defined risk per trade and a way to execute them the same way every time, which is the ground covered in do automated trading bots actually work.
Frequently asked questions
There is no single best one. A practical setup uses one tool per question: a moving average or two for trend, Average True Range for volatility and stop sizing, Volume Profile or VWAP for where volume has actually traded, and at most one momentum tool such as RSI or MACD. All are built into TradingView, so the calculation is documented and identical for every user.
Most do. TradingView states that more than 95% of indicators in existence exhibit some form of repainting behaviour, which they define as script behaviour causing historical and realtime calculations or plots to behave differently. They also note that commonly used indicators such as MACD and RSI show confirmed values on historical bars but fluctuate on a realtime bar until it closes.
No. TradingView writes that not all repainting behaviour is inherently useless or misleading, and points out that nobody would discredit a volume profile indicator simply because it updates on realtime bars. What matters is knowing which value your rule refers to, the live one or the value confirmed at the close, and configuring your alert to match.
Not reliably. TradingView states that with an invite-only script nobody can add it to a chart without explicit permission from the author and only the author can see the source code, and with a protected script only the author can see the source. With no visible source you cannot check for repainting or future data, and there is no code to convert into a strategy.
You can look at them, but do not measure a system on one. TradingView states that performance results from a strategy applied to non-standard charts, which includes Renko, Heikin Ashi, Kagi, point and figure, line break and range, do not reflect actual market conditions by default, because the prices and time intervals do not match market prices and times.
TradingView allows a maximum of 64 plot counts per script, and each alertcondition() call uses one of them. Script execution across a dataset is capped at 20 seconds for basic accounts and 40 for others. In practice chart responsiveness becomes the real limit well before you reach the published ceilings.
Eli Y.
Eli builds and runs rules-based automated futures systems on TradingView and Tradovate, and helps traders take emotion out of the screen. He writes about futures automation, prop-firm evaluations, and the tools that connect them - plainly, and without hype.
Risk disclosure: Trading futures involves substantial risk of loss and is not suitable for everyone. This article is educational content only and is not financial advice or a recommendation to trade. Past performance is not indicative of future results. Some links are affiliate links.