How to Backtest a Pine Script Strategy, and the Defaults That Flatter It

Heads up: some links below are affiliate links. If you sign up through them we may earn a commission at no extra cost to you - it never changes what we recommend.
Declare the script with strategy() instead of indicator(), add it to the chart, and open the Strategy Tester to read the report. That part takes a minute. The real work is the Properties tab, where the default account size is one million dollars.
The LPFT Copilot runs a tested, rules-based method on your own Tradovate account, so there is no script to write and no Properties tab to get right. 7-day free trial.
Start your 7-day free trialHow to backtest a Pine Script strategy, in four steps
The mechanics are genuinely quick, so here they are first, and then the rest of this post is about why the number at the top of the report is usually kinder than reality.
- Declare it as a strategy. Open the Pine Editor at the bottom of the chart. The script must call strategy(), not indicator(). TradingView states plainly that Pine Script indicators contain calculations but cannot be used in backtesting, so an indicator will never produce a report no matter what else you do. The difference is in indicator versus strategy.
- Add order commands. A strategy needs at least one entry and some way out. Until an order call exists there is nothing to simulate.
- Add it to the chart. The Strategy Tester panel opens at the bottom, with the performance summary, the list of trades and the properties in separate tabs.
- Open Properties before you read anything. This is the step that gets skipped, and it is the one that decides whether the report describes your account or a fictional one.
If you are still learning the language itself rather than testing a finished idea, Pine Script for beginners starts further back than this post does.
The default nobody changes: a one million dollar account
TradingView documents the Initial Capital property as the amount of funds initially available for the strategy to trade, in the currency defined in Base Currency, and states that by default this value is equal to 1,000,000.
A million dollars is not your account. It is not a prop evaluation account either. This single default distorts almost everything people quote from a report. A percentage return calculated against a million dollars looks modest and safe while the same trades on a real account would have breached a drawdown limit twice. Position sizing inherits the same problem, because a fixed contract count that is trivial against a million is a large bet against a few thousand.
Set it to what you will actually fund. If the strategy stops looking viable at your real account size, that is not a bug in the test, that is the test finally working.
TradingView states that by default the strategy is recalculated at the close of each bar, and that strategies only calculate on the close of realtime bars unless you enable calculation on each update. Separately, Verify Price For Limit Orders defaults to 0, which they explain means limit orders are filled on historical data as soon as the price indicated in the order is reached. That is a generous assumption about a fill you would have had to queue for in real life.
Commission and slippage are yours to supply
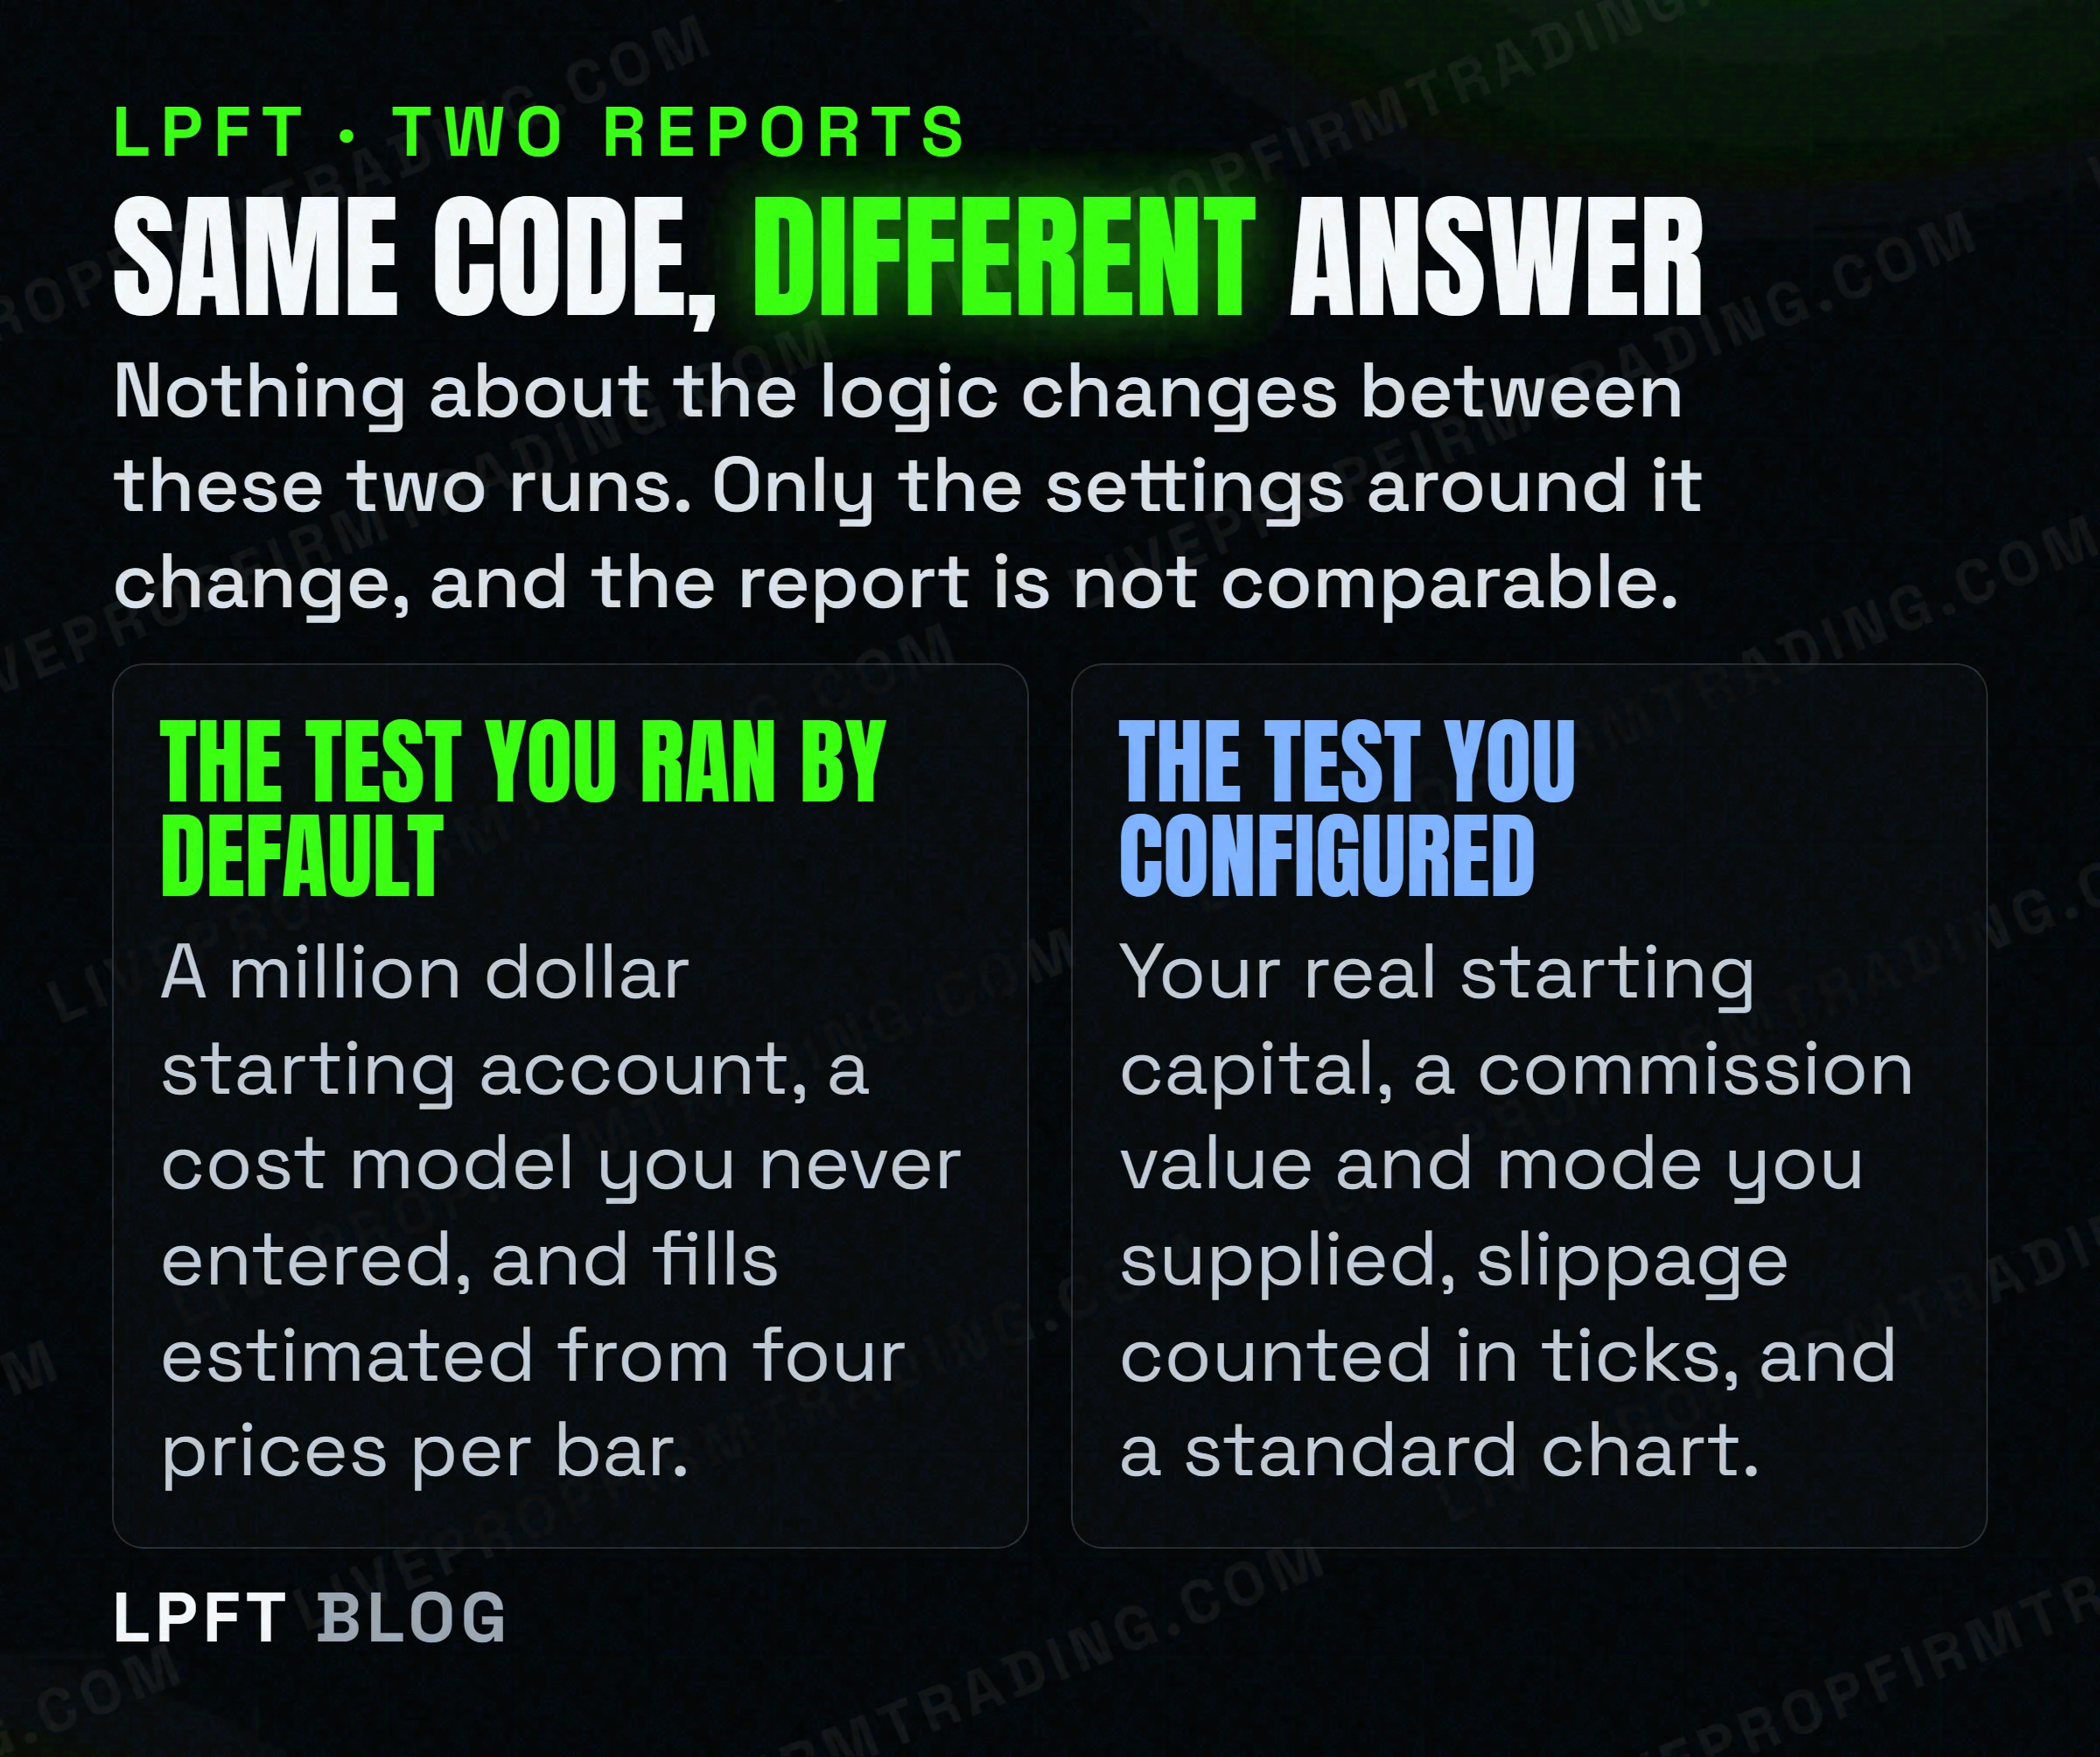
TradingView describes Commission as the amount paid in trading fees for each trade, and states that a value and calculation mode must be supplied. Slippage is described as the value in ticks to be added to the fill price of market or stop orders, and they note it can be used to account for the spread.
Read that carefully, because it is the part the rest of the internet gets wrong in the other direction. The point is not a specific number that TradingView pre-fills. The point is that these are inputs you are responsible for. If you have never opened the Properties tab, you are reading a report built on a cost model you never chose, and on futures the costs are not a rounding error. Commissions plus exchange fees apply to every contract on both sides, and a one tick difference in fill price on a Micro E-mini S&P 500 contract is 1.25 dollars, since the contract is 5 dollars times the index with a minimum tick of a quarter of an index point.
Multiply that across a few hundred trades and a report that showed a modest edge often does not. This is the most common way a strategy looks good on a screen and loses money in an account, and it is covered from the habits side in how to backtest before you automate.
A report is a hypothesis. The next step is watching the same rules run forward on live data, which needs something to carry the signal from TradingView to a broker. TradersPost is a cloud service that receives TradingView webhooks and routes them to a broker, and Tradovate is explicitly supported. There is a free 7-day trial.
See TradersPost →What the emulator is guessing about every historical bar
A historical bar gives the emulator four prices. Real trading gives you every tick in between. TradingView is unusually honest about how it bridges that gap, and these sentences are theirs.
- On order sequence: if the opening price of a bar is closer to the high than it is to the low, the emulator assumes that the market price moved in this order, open to high to low to close. The mirror rule applies for an open nearer the low.
- On gaps: the emulator assumes no gaps exist within bars, and treats any price in the range of the bar as valid for filling a pending order.
- On what the script could see: during the extra script execution after an order fills, the script has access to the confirmed OHLC values for the historical bar, but those values would not be available in the real world until the closing time of the bar.
That last one is a lookahead admission in TradingView's own words, and it is the strongest argument for treating any single report as a hypothesis rather than a measurement. On Premium and Ultimate plans the Bar Magnifier setting reduces the guessing by retrieving open, high, low and close prices from bars on a suitable lower timeframe, when possible, to increase the number of ticks available for estimating price action and filling orders on historical bars.
There is also a chart type rule that catches futures traders in particular. TradingView states that performance results from a strategy applied to non-standard charts, naming Heikin Ashi, Renko, line break, Kagi, point and figure and range, do not reflect actual market conditions by default. Those chart types are popular on futures, and a report produced on one is not a report about the market.
The 9,000 wall, and what Deep Backtesting changes
A default backtest does not see all of history and does not keep all of your trades. TradingView states that if a strategy uses the default testing range it preserves individual data for up to the latest 9,000 trades, and their limitations page phrases the same ceiling as a maximum of 9,000 orders when backtesting. A high frequency rule on a short timeframe hits that ceiling quickly, and when it does your report describes a window rather than the whole test.
Deep Backtesting is the way past it. TradingView describes it as an additional mode of the Strategy Report which makes it possible to calculate the strategy on all historical data available for the selected symbol, and not only on those loaded on the chart, with a limit of up to two million bars and one million trades. They state it is available for Premium and higher plan users.
| Default testing range | Deep Backtesting | |
|---|---|---|
| Data used | The bars loaded on your chart | All historical data available for the symbol |
| Trade detail kept | Up to the latest 9,000 trades | Up to one million trades |
| Data ceiling | What the chart holds | Up to two million bars |
| Date range | What is loaded | You select a specific range |
| Plan needed | Any plan | Premium and higher |
More history is better than less, but it is not the same as proof. A longer sample with the wrong costs and a million dollar account is a more elaborate version of the same mistake.
Before you believe the report
- Set Initial Capital to your real funding amount. The default is 1,000,000 and it changes how every percentage in the report reads.
- Enter a commission value and mode, and slippage in ticks. These are inputs you supply. Use your broker and exchange fees, not a guess that flatters the result.
- Check you are on a standard chart. Not Renko, not Heikin Ashi, for the reason TradingView gives.
- Open the List of Trades and read ten at random. You are looking for fills at prices that were never realistically available, which is how the intrabar assumption shows up.
- Check whether you hit 9,000 trades. If you did, the report is a window, not the test.
- Write down how many versions you tried before this one. A result found on the fortieth attempt is a different claim from one found on the first, and nothing in the report records that.
Then treat the whole thing as provisional. Trading futures carries a substantial risk of loss, and a backtest measures a rule against the past, not against the future or against the fills you will actually get. The gap between a clean report and a live account is the subject of paper trading versus live bot testing, and the failure patterns that survive a good backtest are in why automated traders fail. If the indicators feeding the rule are the part you are unsure about, the best TradingView indicators for futures covers which ones can be measured at all.
Frequently asked questions
Declare the script with strategy() rather than indicator(), add at least one order command, then add it to a chart and open the Strategy Tester panel to read the performance summary and list of trades. TradingView states that indicators contain calculations but cannot be used in backtesting, so the strategy() declaration is required.
Because that is the default. TradingView documents Initial Capital as the funds initially available to the strategy and states that by default this value is equal to 1,000,000. Change it in the Properties tab to the amount you will actually fund, since every percentage figure in the report is calculated against it.
They are settings you supply. TradingView describes Commission as the amount paid in trading fees for each trade and states that a value and calculation mode must be supplied, and describes Slippage as a value in ticks added to the fill price of market or stop orders. If you have not opened the Properties tab, you have not set either one.
It is an estimate built from four prices per bar. TradingView states the emulator assumes no gaps exist within bars, infers the intrabar price sequence from whether the open sits nearer the high or the low, and that after an order fills the script has access to confirmed OHLC values that would not have been available in real life until the bar closed. Treat a report as a hypothesis.
TradingView describes it as an additional mode of the Strategy Report that calculates the strategy on all historical data available for the symbol rather than only the bars loaded on the chart, with a ceiling of two million bars and one million trades, available on Premium and higher plans. It is worth it if your default test is hitting the 9,000 trade limit.
You can run it, but the numbers do not describe the market. TradingView states that performance results from a strategy applied to non-standard charts, including Renko and Heikin Ashi, do not reflect actual market conditions by default, because the prices and time intervals do not match market prices and times. Measure on a standard chart.
Eli Y.
Eli builds and runs rules-based automated futures systems on TradingView and Tradovate, and helps traders take emotion out of the screen. He writes about futures automation, prop-firm evaluations, and the tools that connect them - plainly, and without hype.
Risk disclosure: Trading futures involves substantial risk of loss and is not suitable for everyone. This article is educational content only and is not financial advice or a recommendation to trade. Past performance is not indicative of future results. Some links are affiliate links.