Renko vs Candlestick Charts: Only One of Them Shows Real Prices

Heads up: some links below are affiliate links. If you sign up through them we may earn a commission at no extra cost to you - it never changes what we recommend.
Candles measure time, Renko boxes measure price, and only the candle shows prices that traded. TradingView states that a Renko box open and close are synthetic, while its wicks come from real prices. Use Renko to read direction and never to judge a fill.
The LPFT Copilot runs a rules-based system on your own Tradovate account and reports what the broker actually filled, not what a chart estimated. Start a 7-day free trial.
Start your 7-day free trialThe real difference is not noise. It is which prices exist.
Every comparison of these two charts says the same thing. Renko filters noise, candles show patterns, pick whichever suits your style. That is true and it is not the part that will cost you money.
Start with what each one is built from, because TradingView documents both and the wording is precise.
A candlestick covers a period of time you chose. Its body represents the range between the open and close prices, and its shadows extend from the top and bottom of the body to indicate the highest and lowest prices during that timeframe. Four numbers, all of them prices that traded. TradingView notes the format dates to eighteenth-century Japan and that its main use case is price analysis.
A Renko chart is built the other way round. TradingView states that Renko charts measure only price movement, and that the chart is constructed from a series of boxes whose creation is determined by fluctuations in price. Once price moves more than the box size you defined, above or below the most recent box, a new box is added.
TradingView states that boxes always have their corners touching, and that there can never be more than one box in any vertical column. Those two sentences are why a Renko chart looks so clean, and they are also why it structurally cannot draw a gap. An overnight gap on a futures contract is real information, and a Renko chart has nowhere to put it.
TradingView classifies the two families explicitly. Time-based charts use time as the basis for drawing new chart elements, while price-based charts do not factor in time and draw elements only when a specified price change occurs, the price-based set being Renko, line break, Kagi, point and figure and range. The broader version of that split is in time-based versus price-based charts.
What a Renko box is actually made of
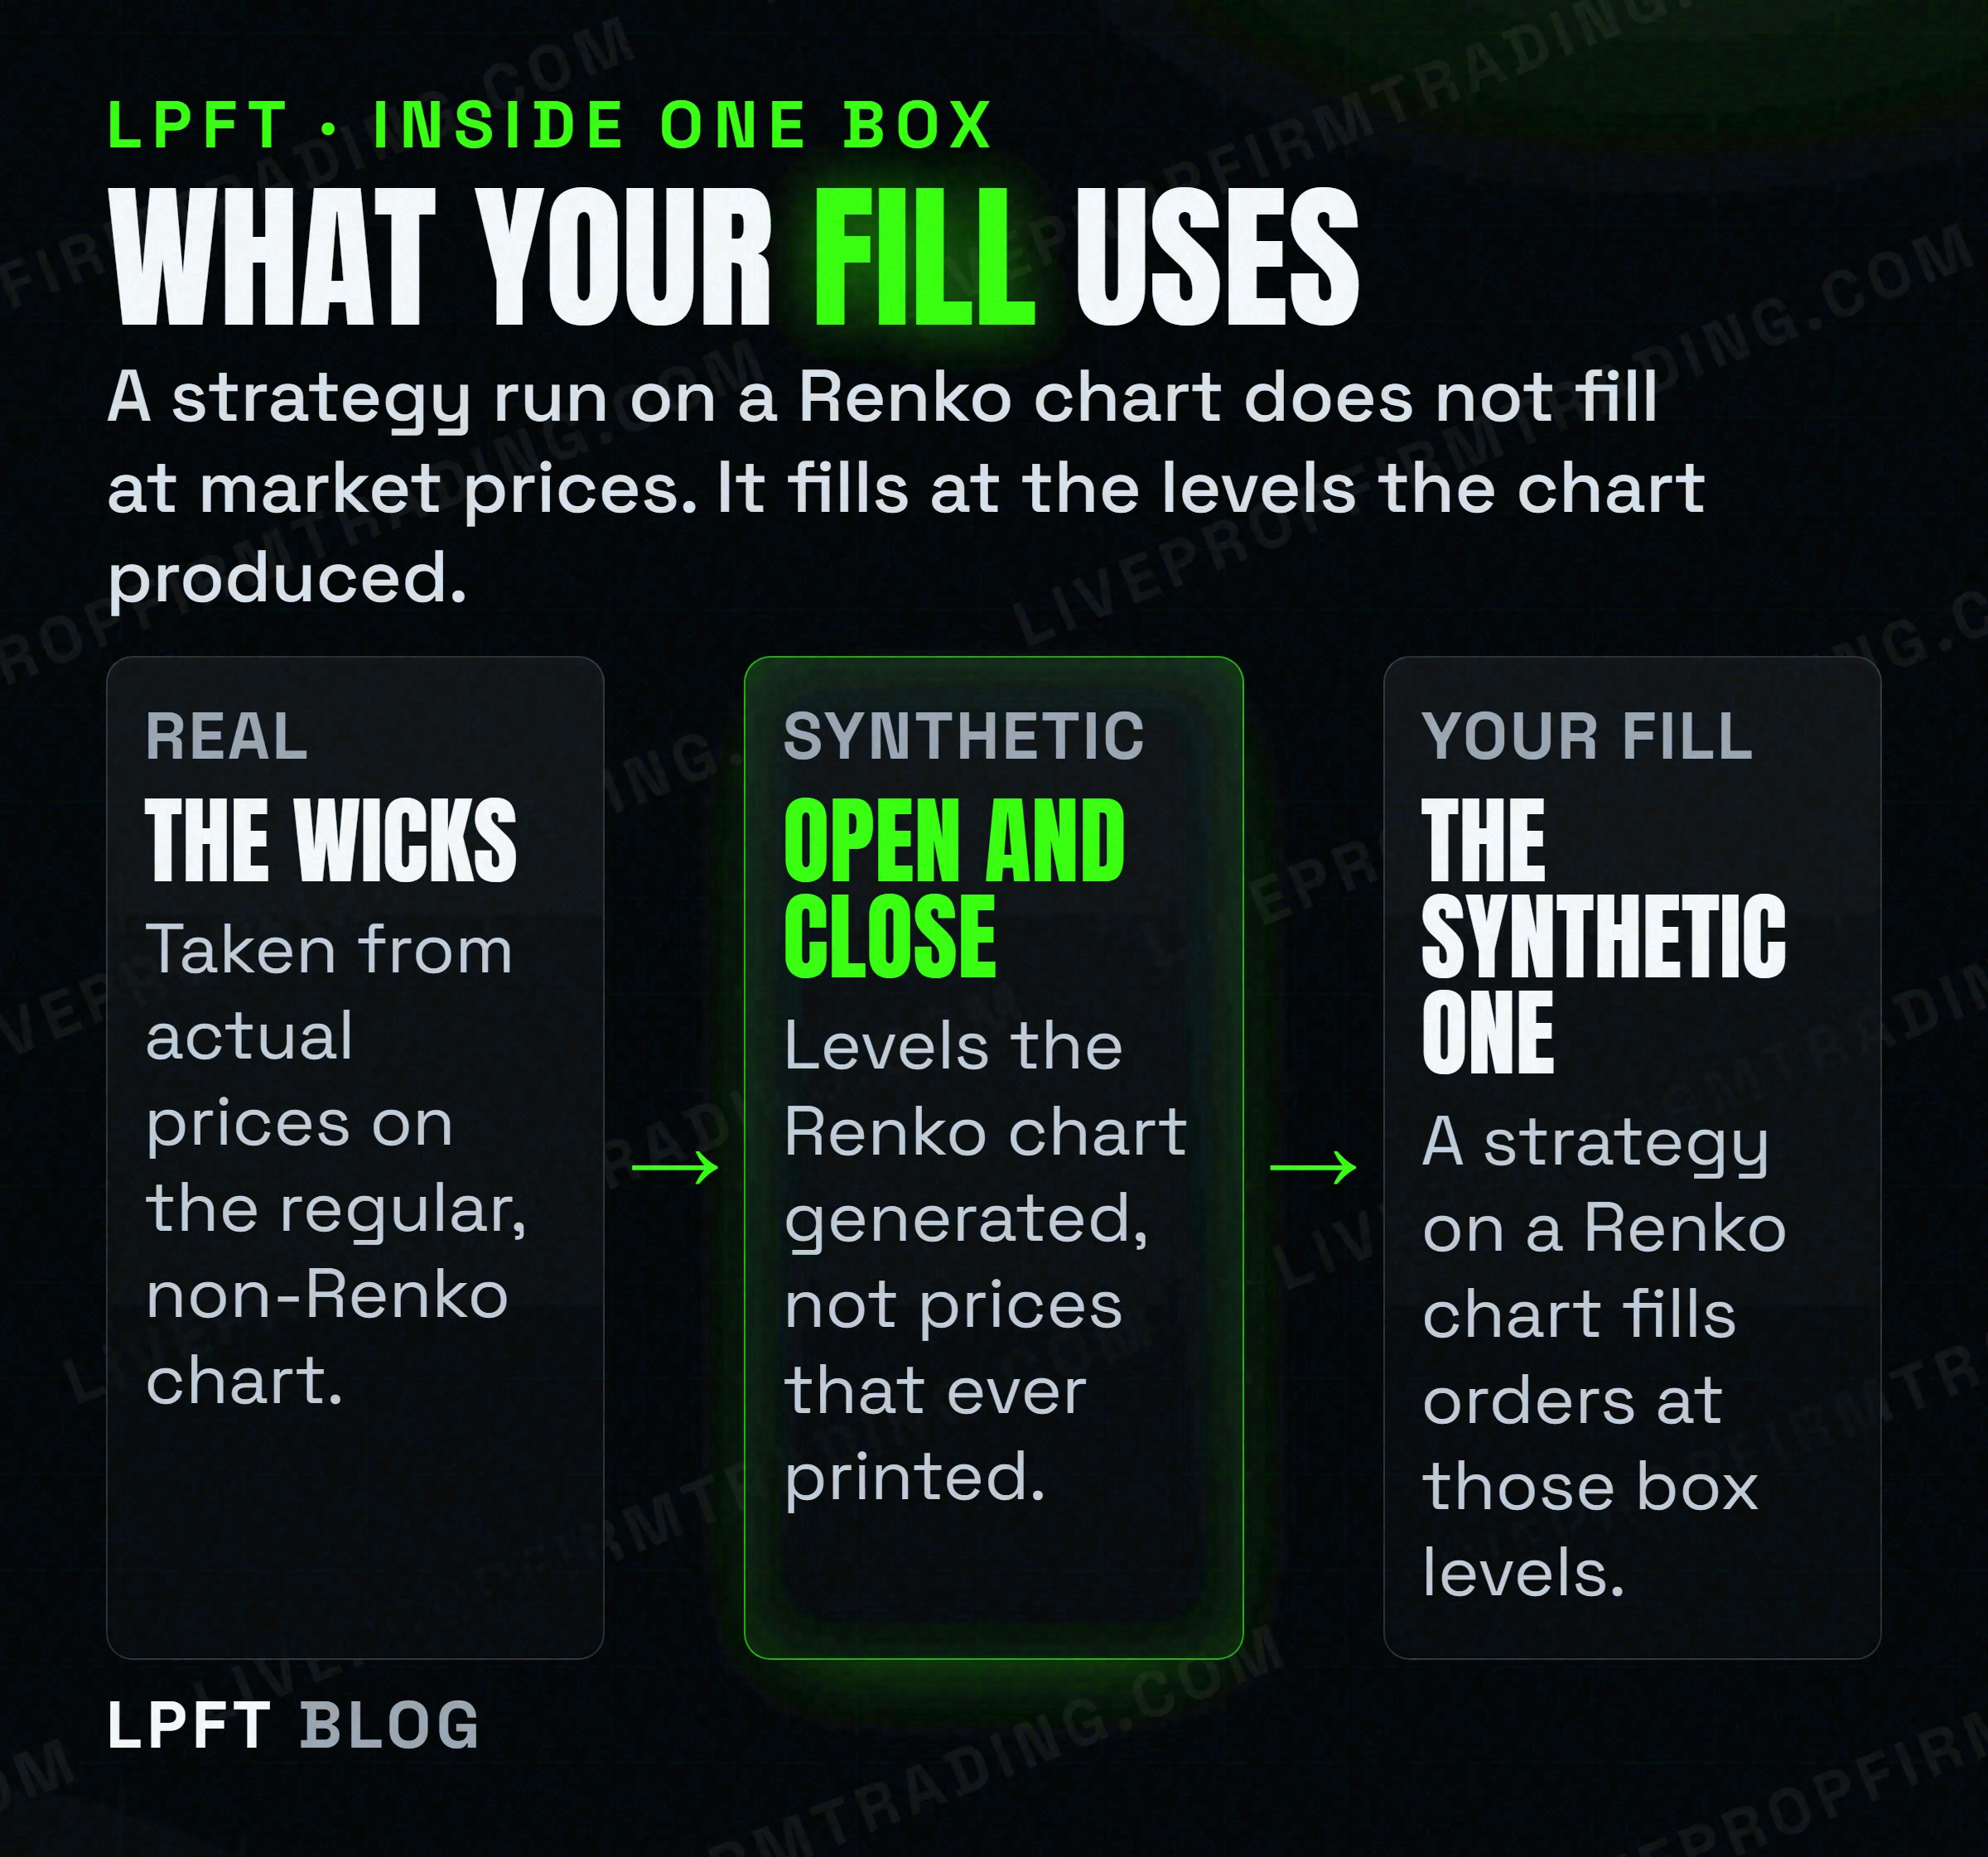
Here is the single most useful sentence on this whole subject, and it is theirs rather than ours. Renko wicks are based on actual prices present on the regular, non-Renko chart, unlike Renko boxes open and close, which are synthetic.
Read that slowly if you trade from these charts. The parts most people ignore, the thin lines poking out of the boxes, are the real market. The parts everyone reads, the neat stacked bodies, are values the chart generated to keep the geometry tidy.
TradingView explains what the wicks are for as well. On a Renko chart, wicks show major price moves inside a Renko box, if they happened. High wicks appear only on downward boxes and low wicks only on upward ones, which makes them the record of a move that came close to turning the chart around and did not. They are enabled by default, and they can be switched off in the chart settings. Switching them off removes the only honest prices on the chart.
Which brings us to the consequence that matters for anyone automating. TradingView states that Renko box levels, being disconnected from actual market prices at any given moment, will fill orders using their own prices and therefore will not produce reliable strategy results. Elsewhere they put it even plainer: these results are calculated using the Renko chart's synthetic prices, which most likely do not reflect the actual order fills you would get if you were trading for real.
In TradingView's repainting documentation, a strategy that executes on a non-standard chart is filed under unacceptable, alongside scripts that leak future data into the past. Not "be careful". Unacceptable. Their strategy pages add that performance results from a strategy applied to non-standard charts, naming Renko among them, do not reflect actual market conditions by default. The tiers are explained in TradingView backtest repainting.
Time never actually left. It just went quiet.
The usual claim is that Renko removes time from the chart. It removes time from the horizontal axis. It does not remove time from the calculation, and TradingView is unusually direct about this.
They state that accurate Renko box calculation requires tick data, and that a ten minute Renko chart will use ten minute closes to generate its boxes. Then comes the sentence nobody quotes: only when the ten minute interval has expired are all produced boxes locked into Renko history.
So the boxes on the interval currently forming are not final. They can still change. Anyone who has watched a Renko chart during a fast move has seen this happen and assumed the chart glitched. It did not. It behaved exactly as documented, and it is the same realtime-versus-historical split that makes indicators behave differently on a live bar.
TradingView says as much when explaining why Renko strategy results are unreliable: the formation of boxes in real time is different from recorded historical data. Two different processes, one chart, and the version you backtested is the recorded one.
For the practical reading side of this, including what the boxes tell you once you know what they are, see how to read a Renko chart.
The box size decision is really the whole chart
On a candlestick chart you choose an interval and the data does the rest. On a Renko chart you choose the unit of movement, and that choice changes how many boxes exist, where they sit and what the chart appears to be saying. TradingView offers three methods for it.
| Method | How TradingView describes it | What it costs you |
|---|---|---|
| ATR | Uses the values generated by the Average True Range indicator, which is used to filter out the normal noise or volatility of a financial instrument. You set the look-back period. | The unit moves as volatility moves, so two screenshots of the same instrument may not be comparable. |
| Traditional | Uses a user-predefined absolute value. TradingView guidance is that a common approach is to pick about one twentieth of the current value of the instrument. | Fixed and predictable, and it needs experimenting with per instrument. Their guidance is a starting point, not a specification. |
| Percentage | Applies a percentage you define to the most recent closing price, rounded to the nearest minimum tick. | Scales with the instrument, and the unit shifts as price does. |
None of these is wrong. The problem is that the choice is invisible in a screenshot. A Renko chart posted with a clean run of boxes in one direction tells you nothing until you know which method produced it and what value was set, and that is the reason Renko screenshots are so popular with people selling things.
All three methods, the wick toggle and the chart-type list are TradingView features, and the chart types available to you depend on your plan. If you are going to trade from a non-standard chart it is worth knowing exactly which settings produced the one on your screen.
Look at TradingView plans →Which indicators can survive being run on a chart like this is a separate question, and a shorter one than most indicator roundups suggest. It is covered in the best TradingView indicators for futures.
Where each one honestly wins
With the mechanics established, the comparison becomes simple, and it is not a tie.
| Candlestick | Renko | |
|---|---|---|
| What creates a new element | A period of time ending | Price moving by the box size you set |
| Are the plotted prices real | Yes. Open, high, low and close all traded. | Wicks yes, open and close no. TradingView calls them synthetic. |
| Can it show a gap | Yes | No. Corners touch and only one box per column. |
| Reading trend direction | Workable, with more visual noise | Genuinely easier. This is what it is for. |
| Reading pattern detail | Its main use case, per TradingView | Largely erased |
| Suitable for backtesting a strategy | Yes, on a standard chart | No. TradingView states it will not produce reliable strategy results. |
| Duration of one element | Known and fixed | Unknown. Could be seconds or days. |
That last row is worth a sentence of its own, because it is where Renko quietly misleads people who are otherwise being careful. Two adjacent boxes look equally significant. One may have taken four seconds and the other four hours. Nothing on the chart tells you which, and a trader making a judgement about momentum is reading a picture with the clock removed.
So the split is clean. Renko is a viewing tool and it is a good one. Candlesticks are the measuring tool. Confusing the two is how a beautiful backtest turns into an account that behaves nothing like it.
How to use both without fooling yourself
- Look at whichever chart helps you see. If Renko makes direction obvious to you, use it. No documentation anywhere says it is a bad chart to read.
- Measure on a standard chart, always. TradingView states plainly that a strategy on a Renko chart fills at the chart's own prices and will not produce reliable results. Run the test on candles.
- Leave the wicks on. They are the only prices on that chart taken from the real market, and they are on by default for a reason.
- Write down the method and the value. ATR, traditional or percentage, plus the setting. Without both, your own screenshot from last month is not comparable to today.
- Never judge a fill from a box level. The level is synthetic. Your broker fill will not be.
- Distrust any Renko screenshot used as proof. Including a flattering one of your own. The settings that produced it are not visible in the image.
Hold all of that alongside the obvious. Trading futures involves substantial risk of loss, and choosing a different chart type changes what you can see rather than what the market will do. A Renko chart that made a trend look clean in hindsight did not make the trend easier to trade at the time.
If you are heading toward testing a rule on one of these, the settings that decide whether the report means anything are in how to backtest a Pine Script strategy, and the habits around it are in how to backtest before you automate. If the next question is whether the chart can act on what it shows you, that has a precise answer in can TradingView place trades itself.
Frequently asked questions
A candlestick covers a period of time you choose and plots the open, high, low and close that traded in it. A Renko chart ignores time and adds a new box only when price moves by an amount you set. TradingView classes candles as time-based and Renko as price-based, alongside Kagi, point and figure, line break and range charts.
Partly. TradingView states that Renko wicks are based on actual prices present on the regular, non-Renko chart, unlike Renko boxes open and close, which are synthetic. So the thin lines are real market prices and the stacked bodies everyone reads are values the chart generated.
You can run one, and TradingView says the numbers will not be reliable. Their wording is that Renko box levels, being disconnected from actual market prices at any given moment, will fill orders using their own prices and therefore will not produce reliable strategy results. Their repainting docs file a strategy executing on a non-standard chart under unacceptable.
Better for seeing direction, worse for measuring anything. Renko removes the time axis, which makes a trend easier to read and also hides how long each box took, so two identical-looking boxes may represent four seconds and four hours. Candlesticks keep that information and remain the chart to test and size on.
Only on the horizontal axis. TradingView states that accurate Renko box calculation requires tick data, that a ten minute Renko chart uses ten minute closes to generate its boxes, and that only when the ten minute interval has expired are all produced boxes locked into Renko history. Boxes on the forming interval can still change.
TradingView offers three methods. ATR uses values from the Average True Range indicator to filter out normal noise or volatility, with a look-back period you set. Traditional uses an absolute value you define, and their guidance is that a common approach is about one twentieth of the instrument's current value. Percentage applies your percentage to the most recent close.
Eli Y.
Eli builds and runs rules-based automated futures systems on TradingView and Tradovate, and helps traders take emotion out of the screen. He writes about futures automation, prop-firm evaluations, and the tools that connect them - plainly, and without hype.
Risk disclosure: Trading futures involves substantial risk of loss and is not suitable for everyone. This article is educational content only and is not financial advice or a recommendation to trade. Past performance is not indicative of future results. Some links are affiliate links.